If you haven't checked out the repository for the updates of the experiments we have been performing on the three wheel robot modules, check now. We have compared plots on RPM vs PWM at different QEI frequency, The RPM calculation module seems to work fine till now. We have also updated the results of "affect of PWM frequency on RPM vs PWM" and found out that higher frequency gives a more linear plot but also results in heating on motor (inductance is a bitch).
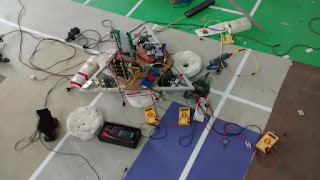
So the next step is to start testing motors on load and no load behaviors and plot RPM vs other parameters. This will serve as a pre-experiment for hysteresis test. The main problem was to load the motor. Mechanical it would require the motor to have contact with some surface hence my system could not be at rest at one position (You cannot ask me to run around with my laptop, taking readings). So we took a 200RPM Vega motor, a coupler and some wires and a potentiometer. The coupler could fix perfectly to the wheel with the help of Allen bolt but the other end had quite bigger diameter than Vega's shaft. So we took suggestions from the mechanical team and tried to tie a grip around it and push the shaft firmly. But it did not work really well, so we kept trying various alternatives. Finally we pushed in some padding and drilled a hole through which another Allen bolt fixed Vega's shaft. We have added a "Load breadboard" which has a potentiometer and it was varied such that multiples of 300mA current (max load current) flows through generator. (300mA was seen from datasheet. Used a little bit of Electrical Machines from second year syllabus to calculate values).
This is the setup.


The observations were noted on the spreadsheet and torque was calculated and found out the plots. The N vs I_armature plot was quite satisfactory and linear with positive slope and it was similar to other plots shown on the internet. But the N vs T and T vs I_armature graphs showed big difference. The graph was like an efficiency graph (inverted V type). While online sources declared it linear with constant slope. I consulted my friend about this and had some thought about it, the theory behind PMDC (as far as we know) would give us such an inverted V curve only, later I found that at many of the graphs online it said at the end point of torque line as "stall torque" i.e. max torque. Maybe I drove my machine further more than stall torque and it resulted in this. I suppose this made the indifference otherwise the graph is quite linear before stall torque.
Please share with me your views on this whether I had done something wrong while taking readings or calculations or if it is possible etc.
So we are gonna try studying hysteresis from today. You can look for the experiment below.
Link to GitHub Repo : https://github.com/DRISHTI-SVNIT/Three-Wheel-Omnidrive-Module-Tests

Cool! It starting to feel a little geeky now!
ReplyDelete